CitiBike Data Visualization Summary
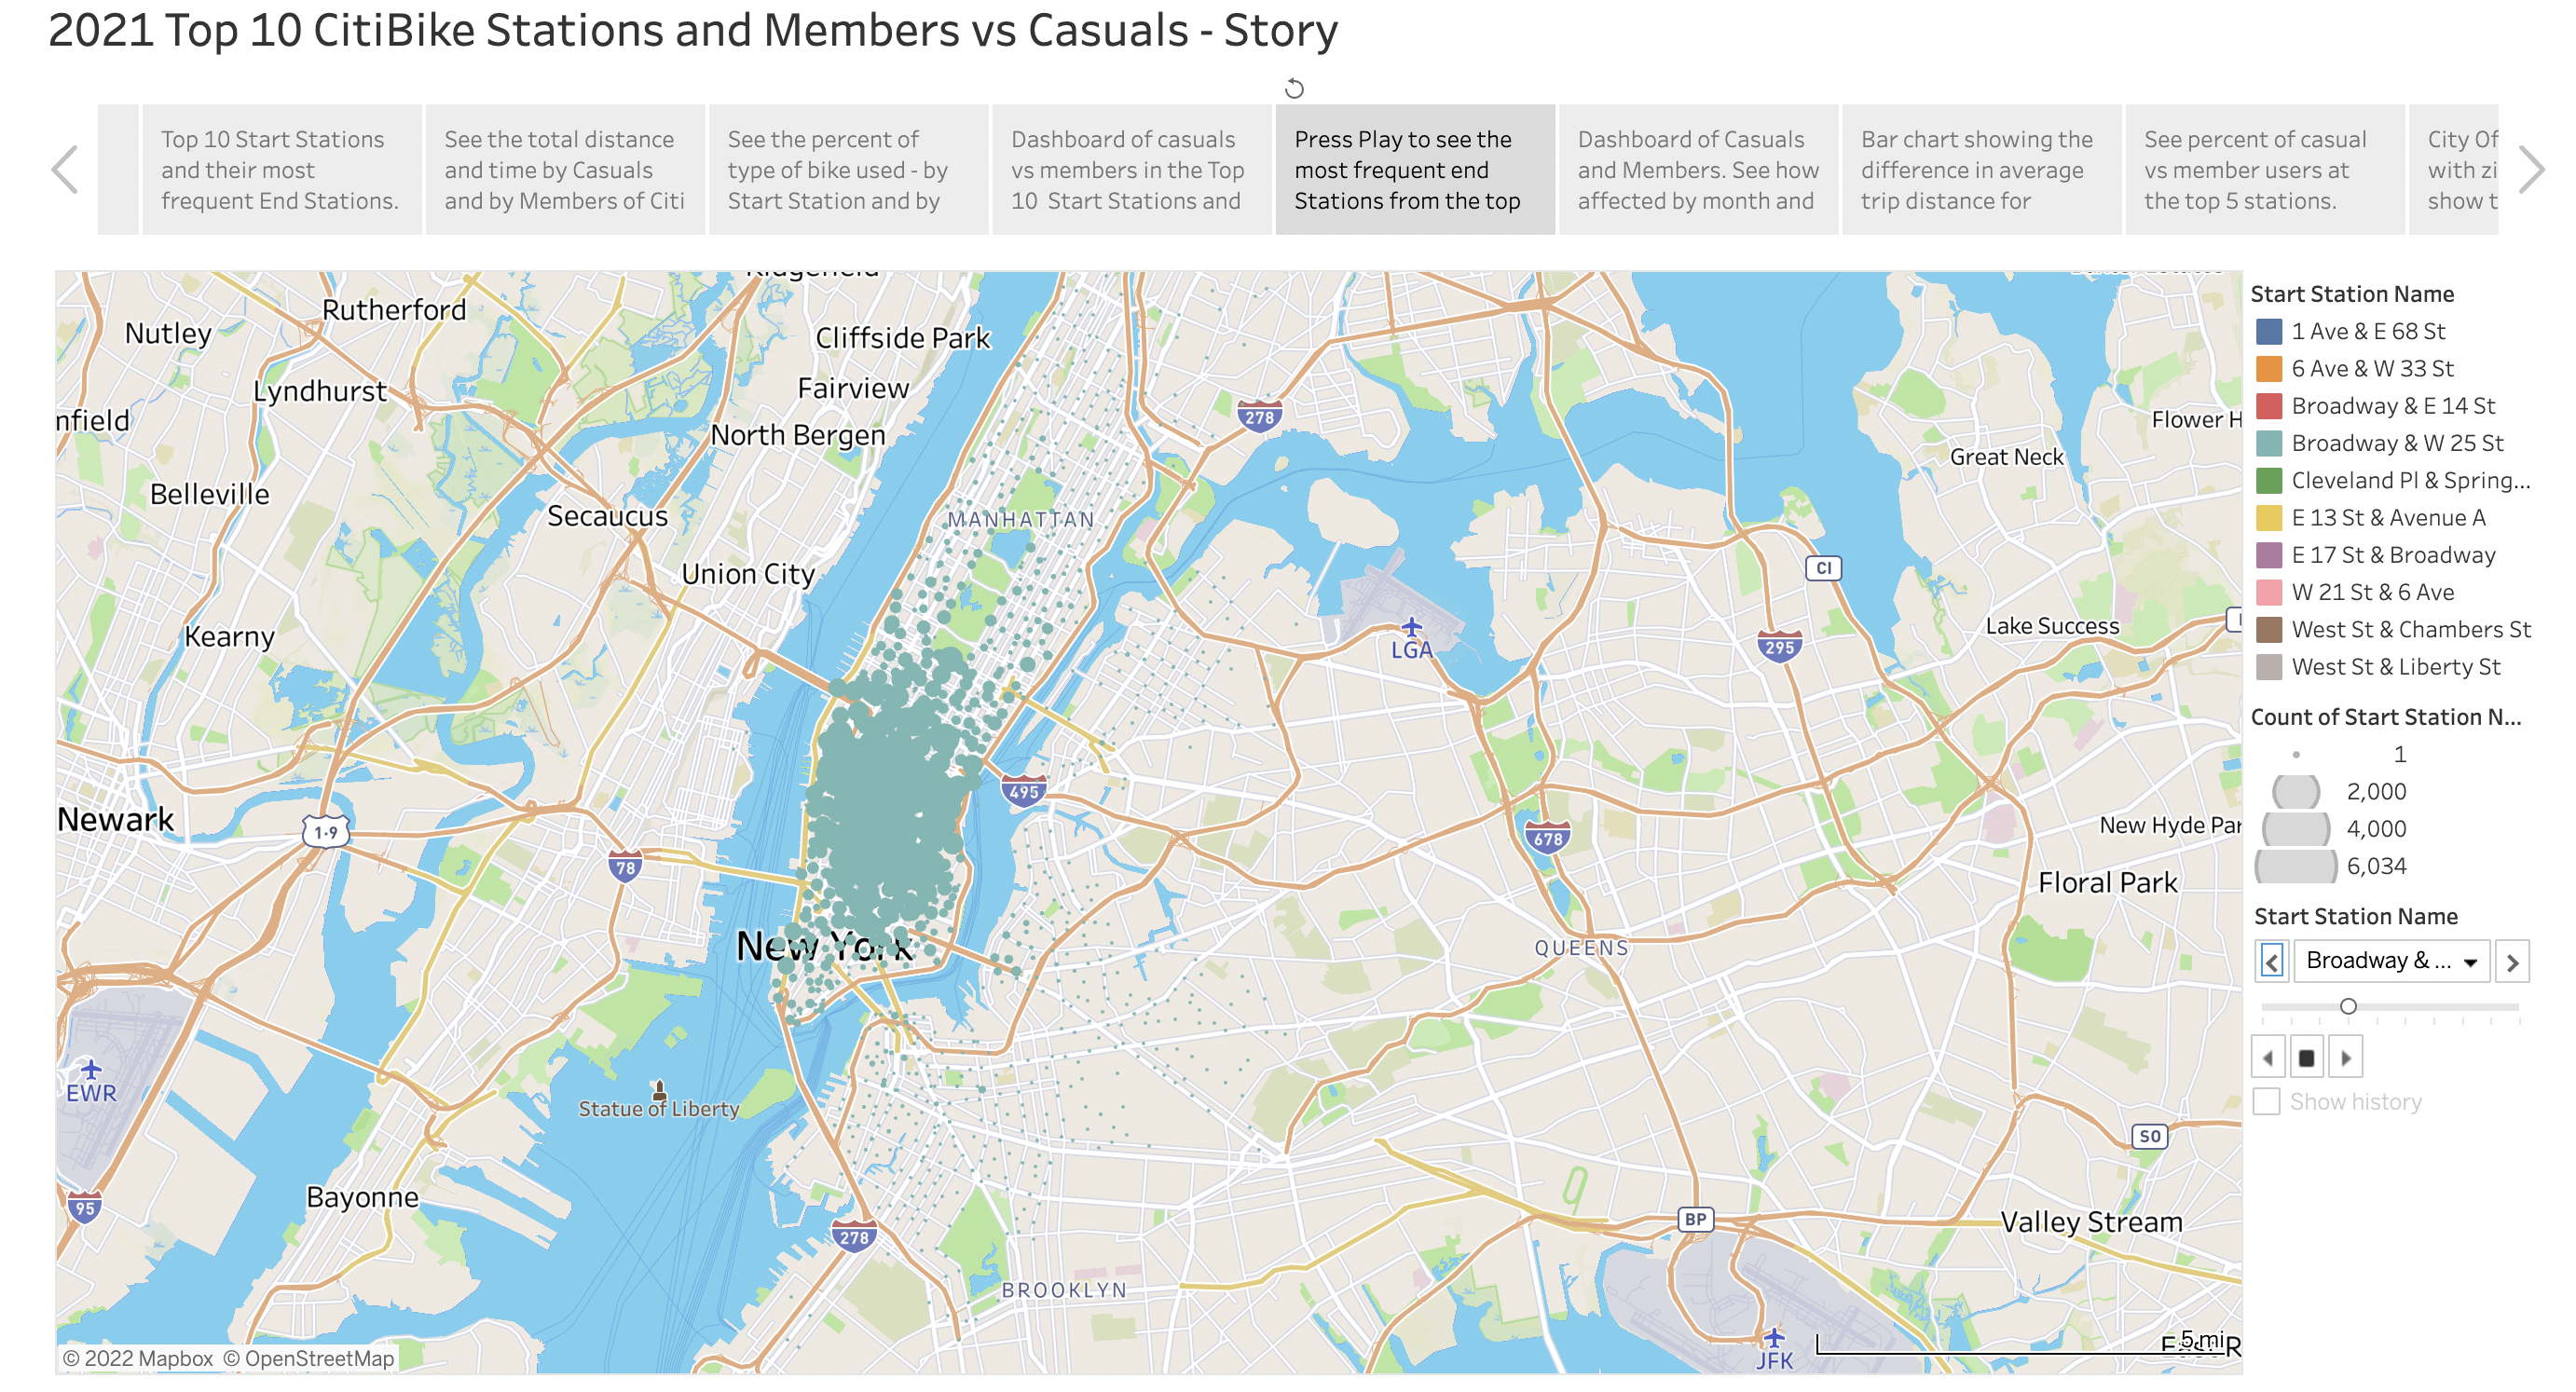
New York City has a large public bike system called the CitiBike, and data is uploaded every month. The goal of this project was to analyze CitiBike's data from the year 2021. The image below displays a snapshot of the Tableau story that was created displaying the top 10 most popular CitiBike stations and their most frequently visted end stations. Python/Pandas was utilized to complie 12 CSV files, and the data was rearranged and cleaned up as needed to help determine the 10 most popular stations. Once the CSV was loaded into Tableau, several plots were created outlining the significance of the most popular stations along with some insight on the use of the bikes by casual users versus members of the CitiBike system.
Preview