Climate and Your Location in the World
This project consisted of determining the relationship of climate and your location on this planet in terms of Latitude. The project was completed using several tools including Python and its associated libraries (Pandas, Matplotlib). Google Map APIs were utilized to collect data, and the data was analyzed using jupyter notebooks. The intent of this exercise was to determine if any relationships could be found based on certain climate parameters and the location of a city based on its latitude.
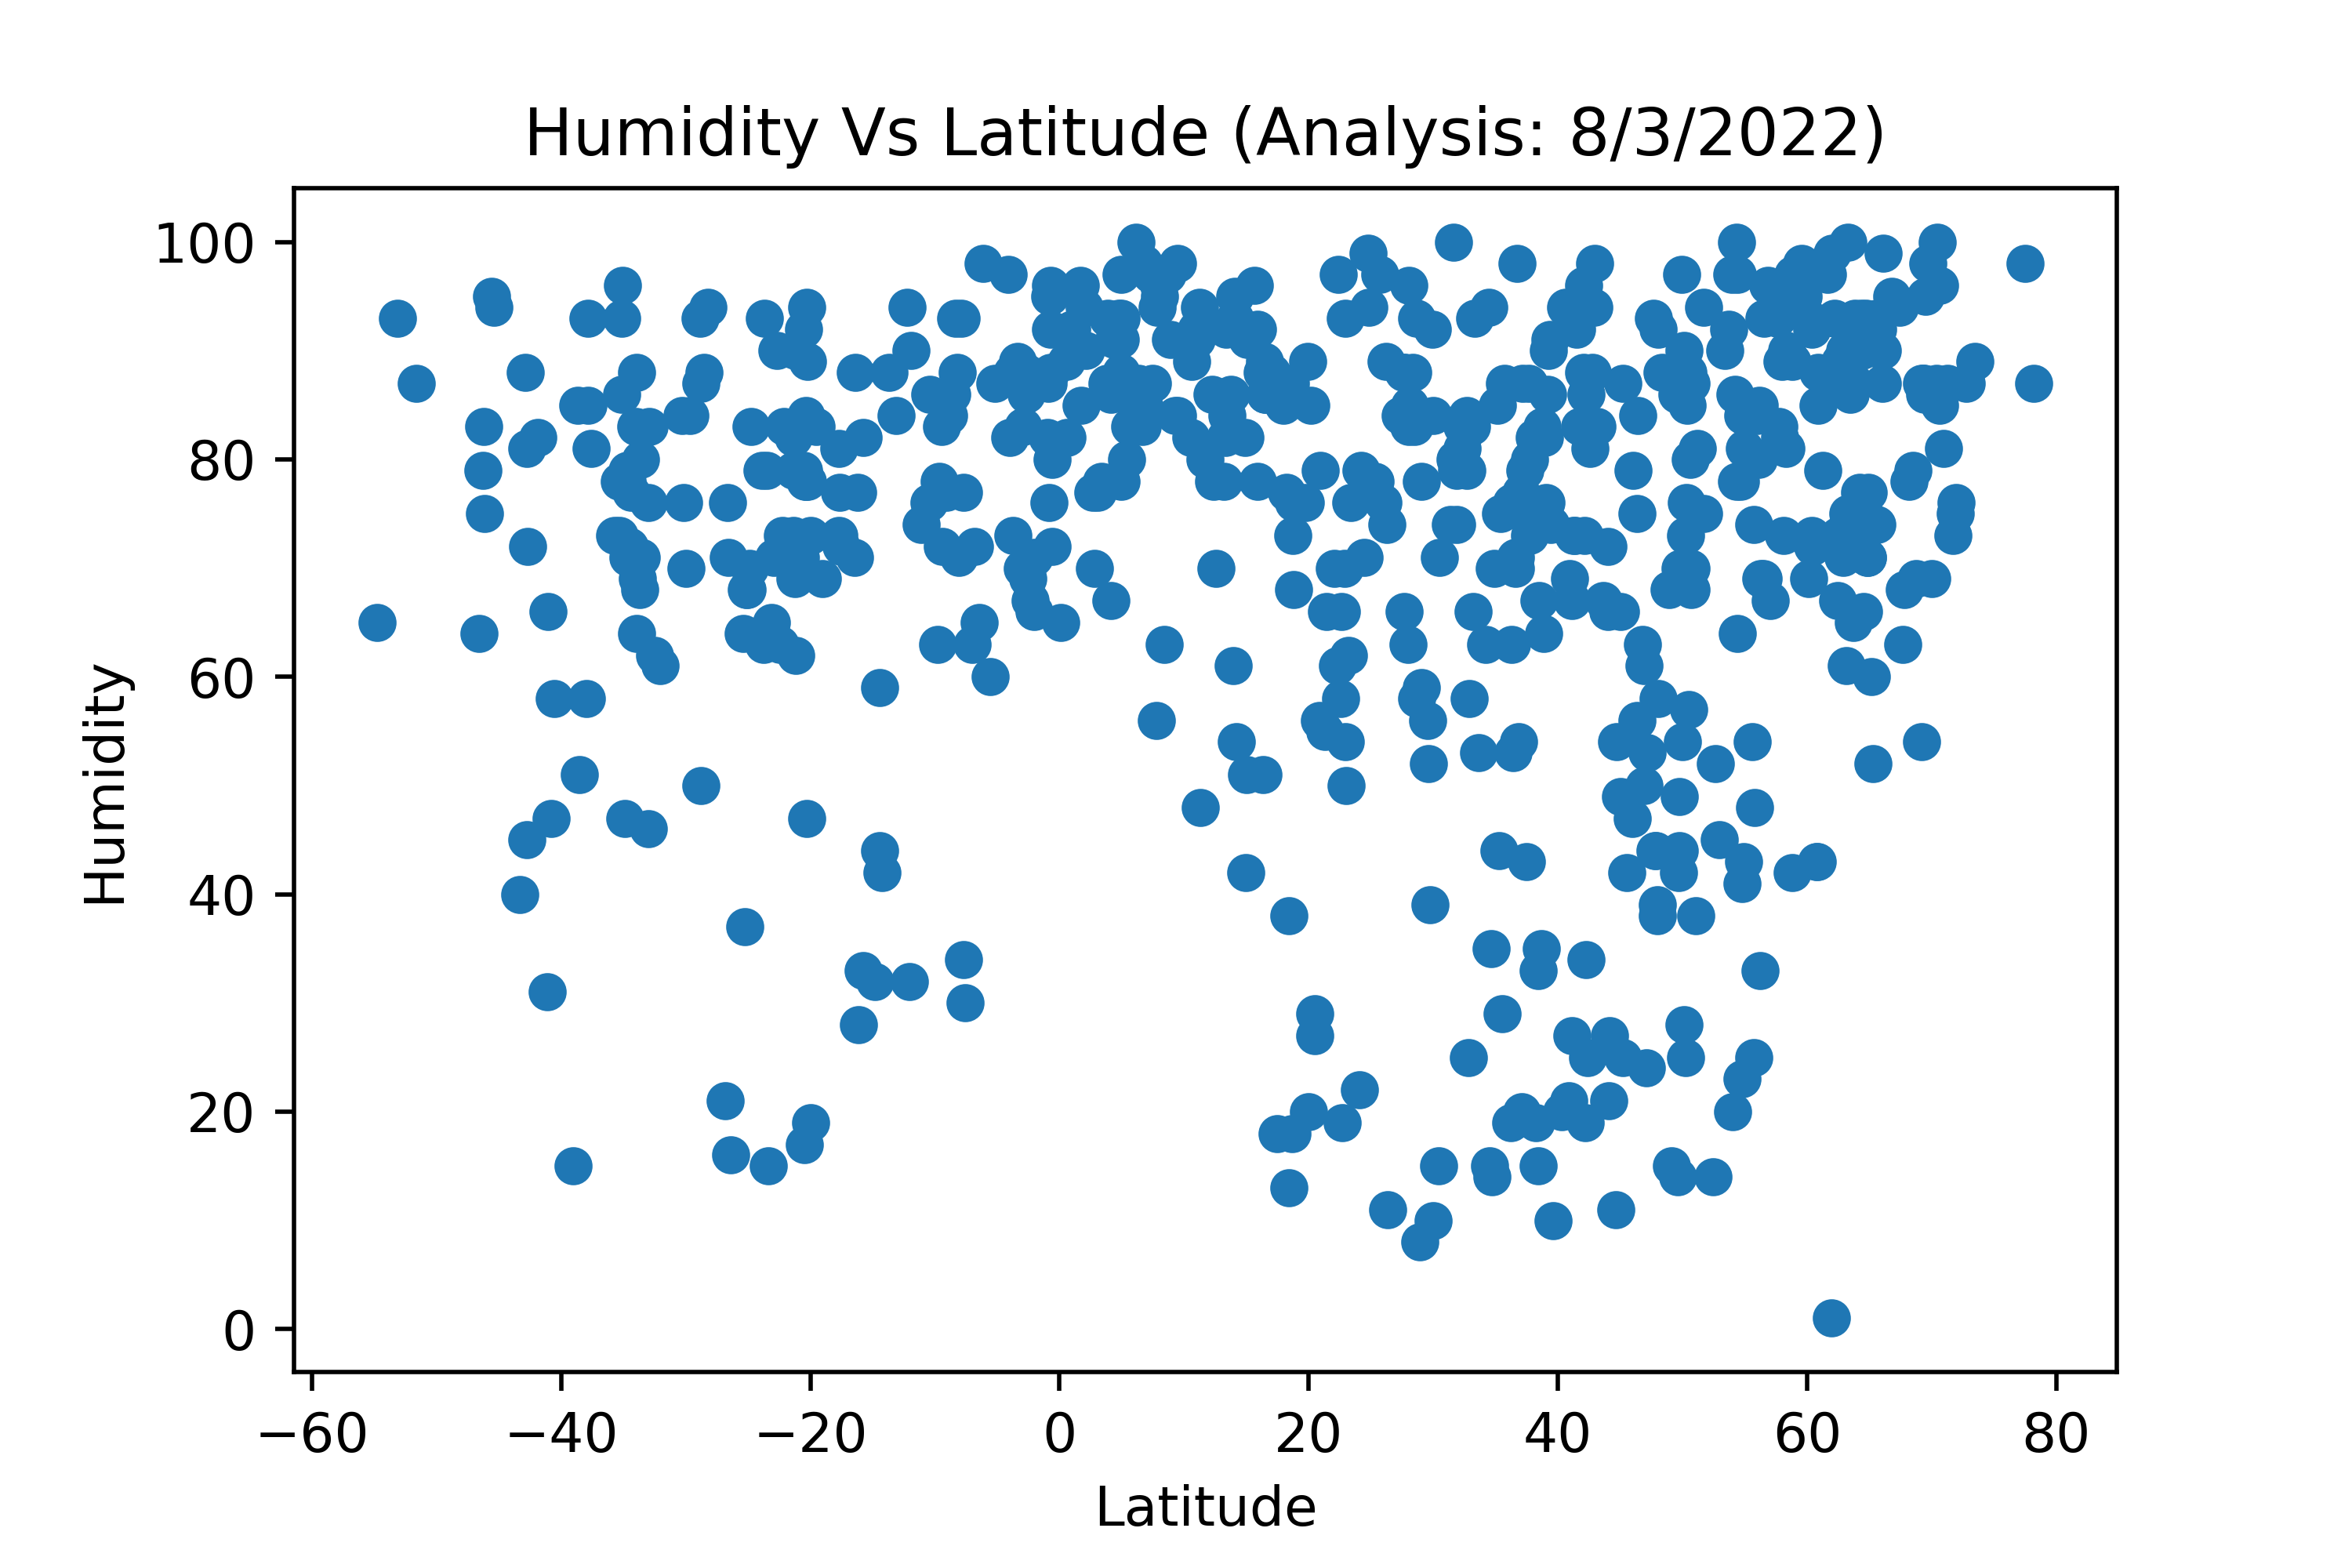
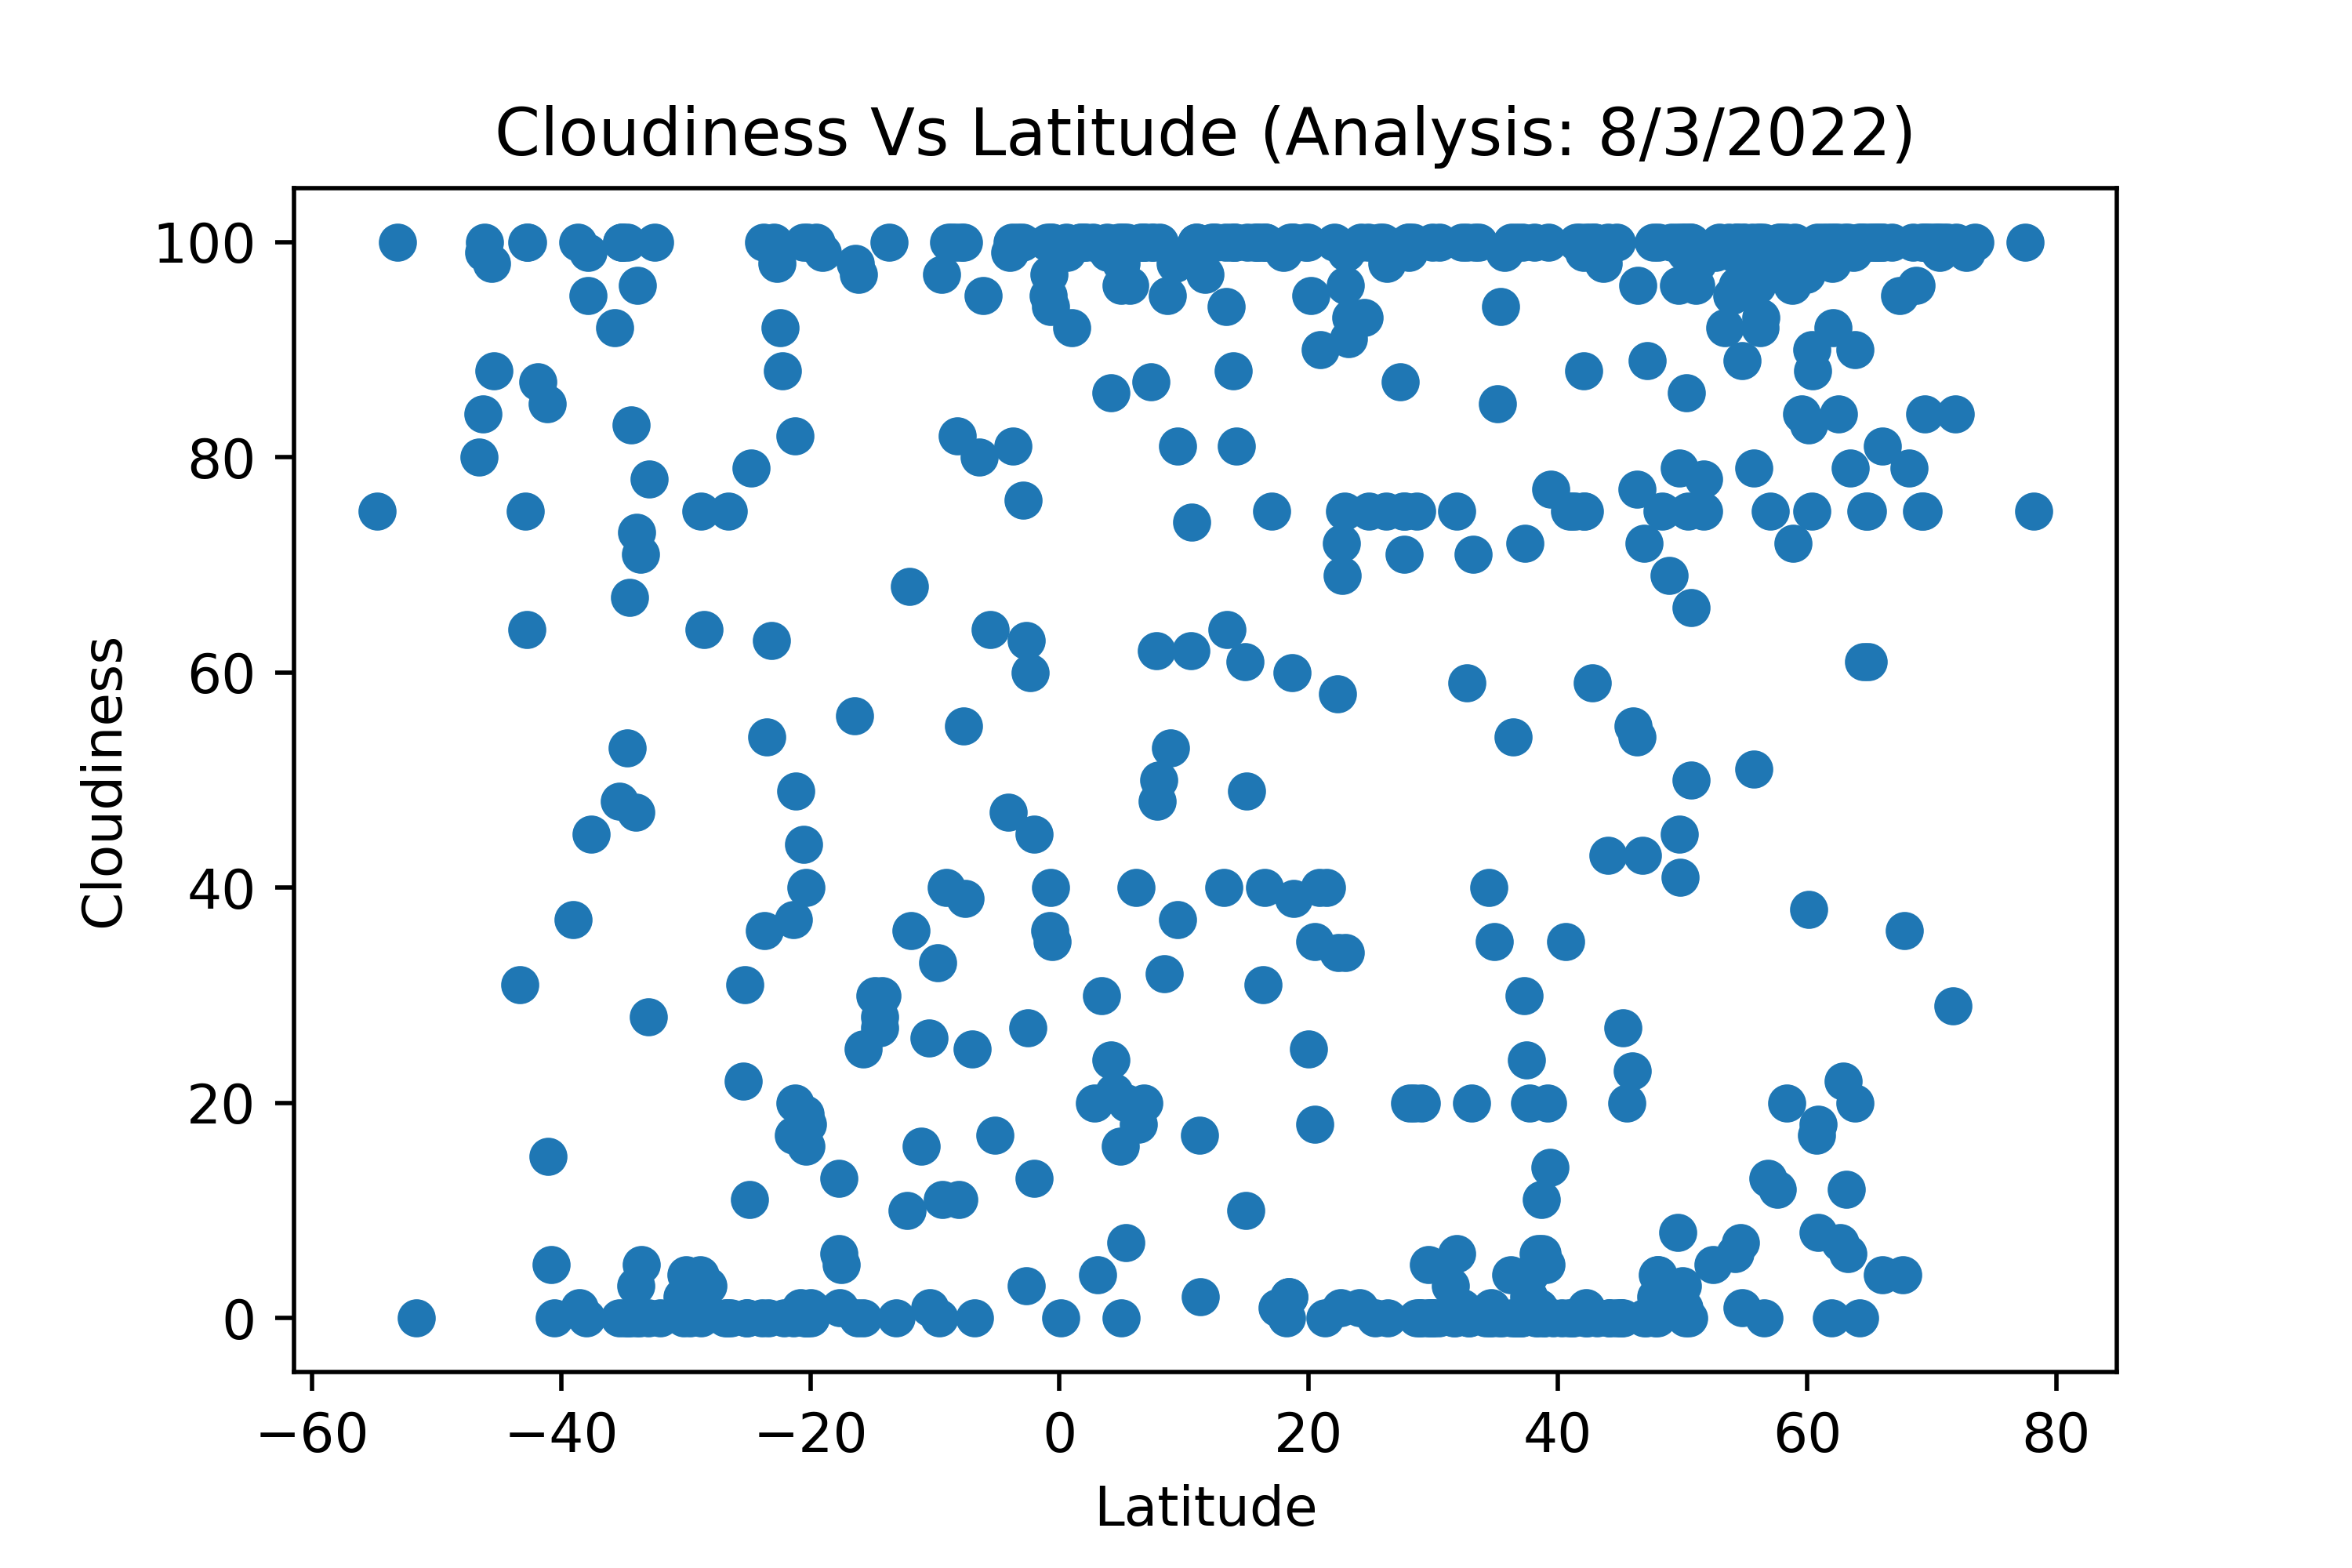
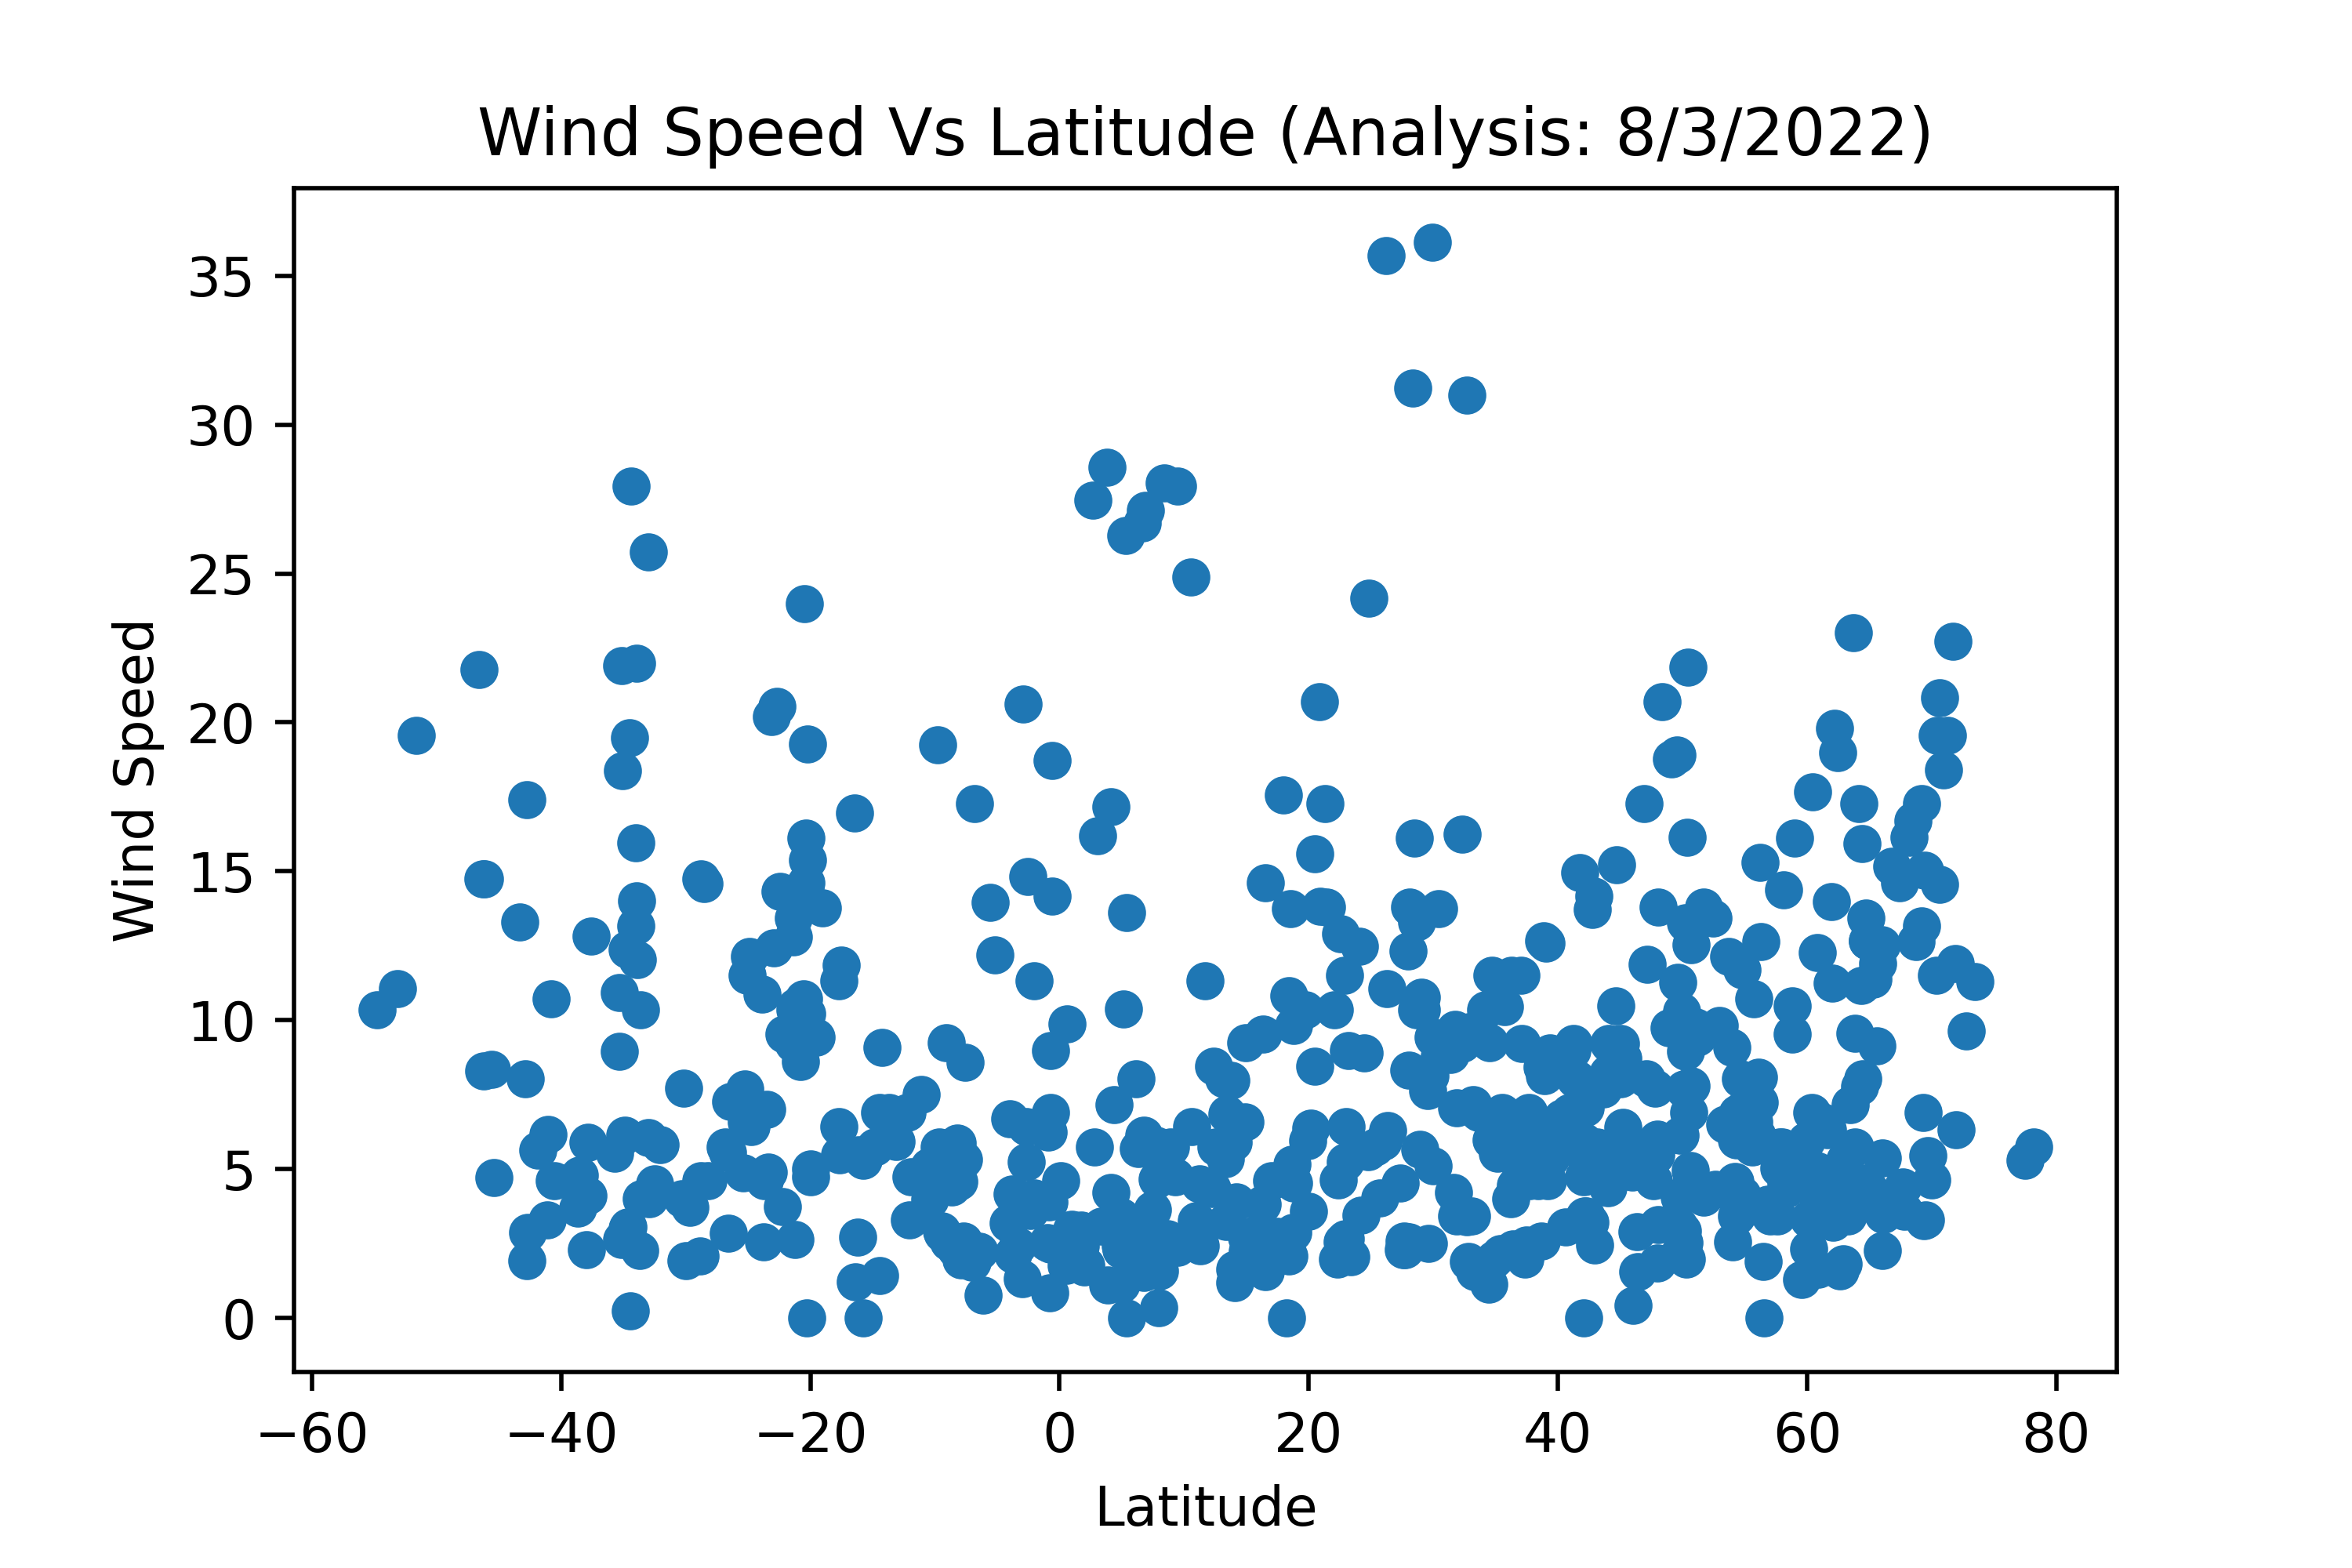
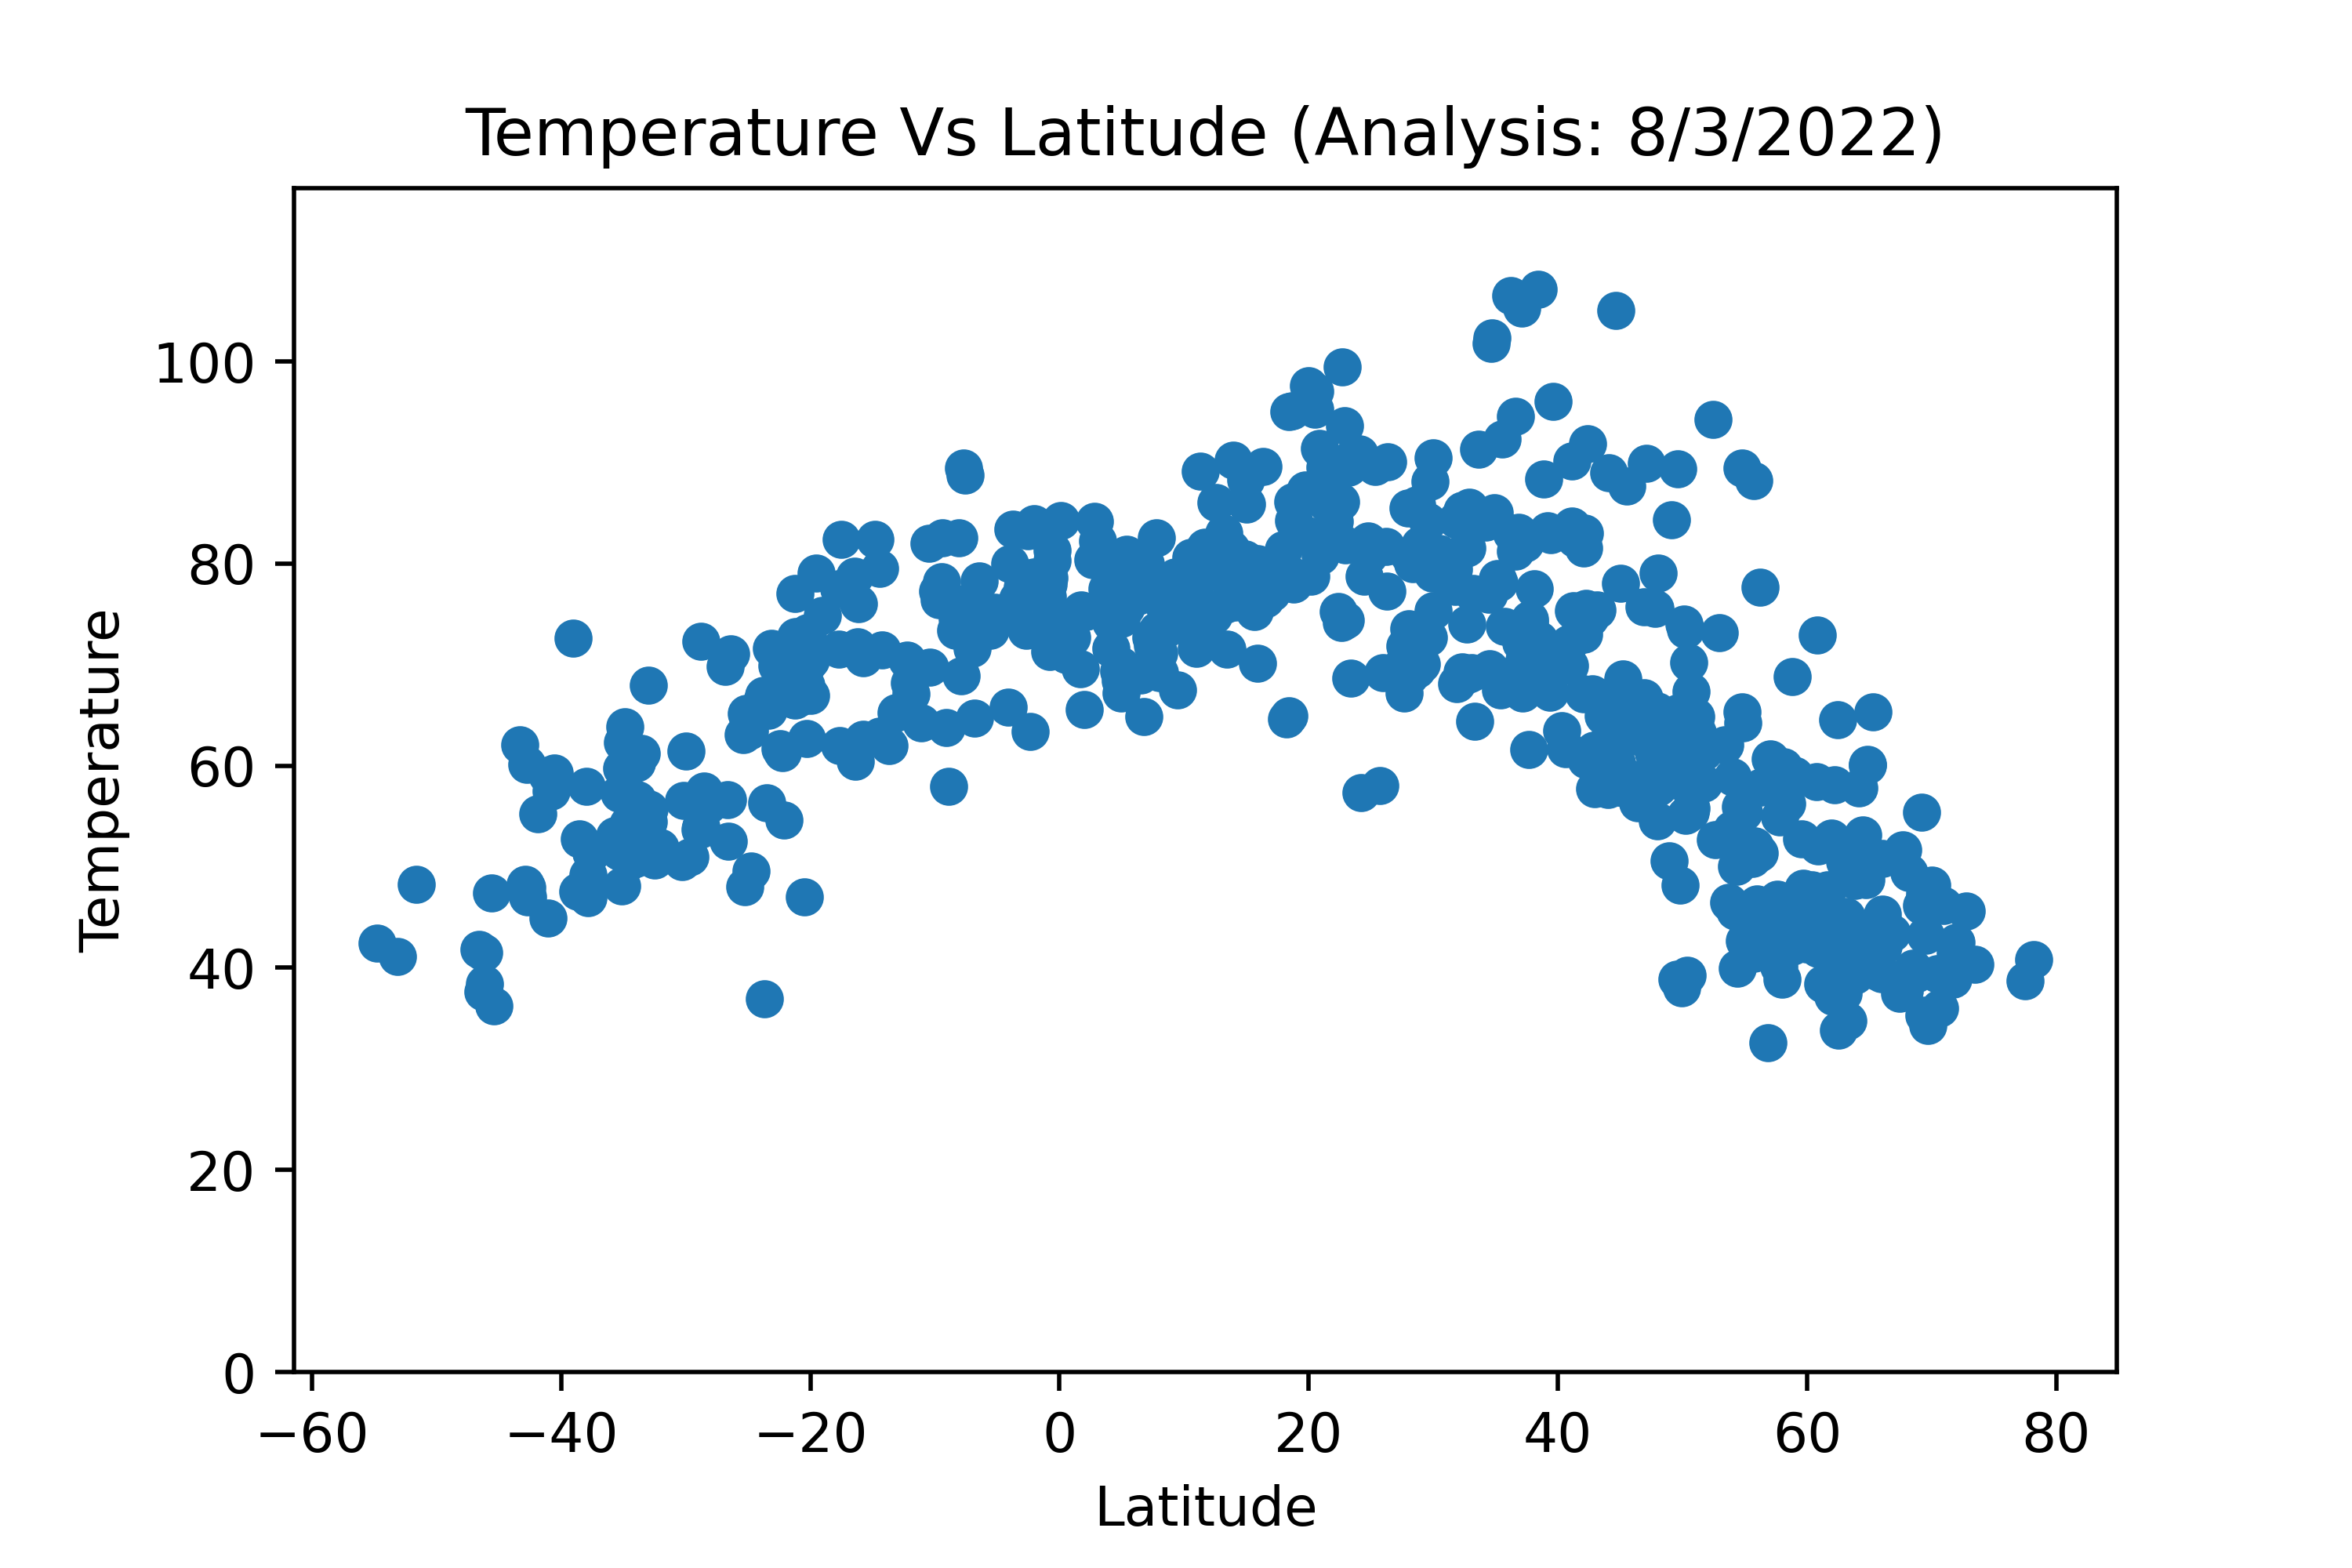
The elements chosen for this particular assingment included Temperature, Humidity, Cloudiness, and Wind Speed. To the right, there are four snapshot previews of the graphs that were created from the data analysis. Those images can be selected to open each respective page or they can also be found under the "Plots" dropdown link in the navigation bar on top of the page.
Visualizations